
For marketing, content & communications
Turn your club's data into content fans actually share
League stats, tracking and video are already sitting in your club. The Hockey Brain brings them together in the club's own database, so your content team can pull the story behind the numbers in minutes – not hours.
What you can make
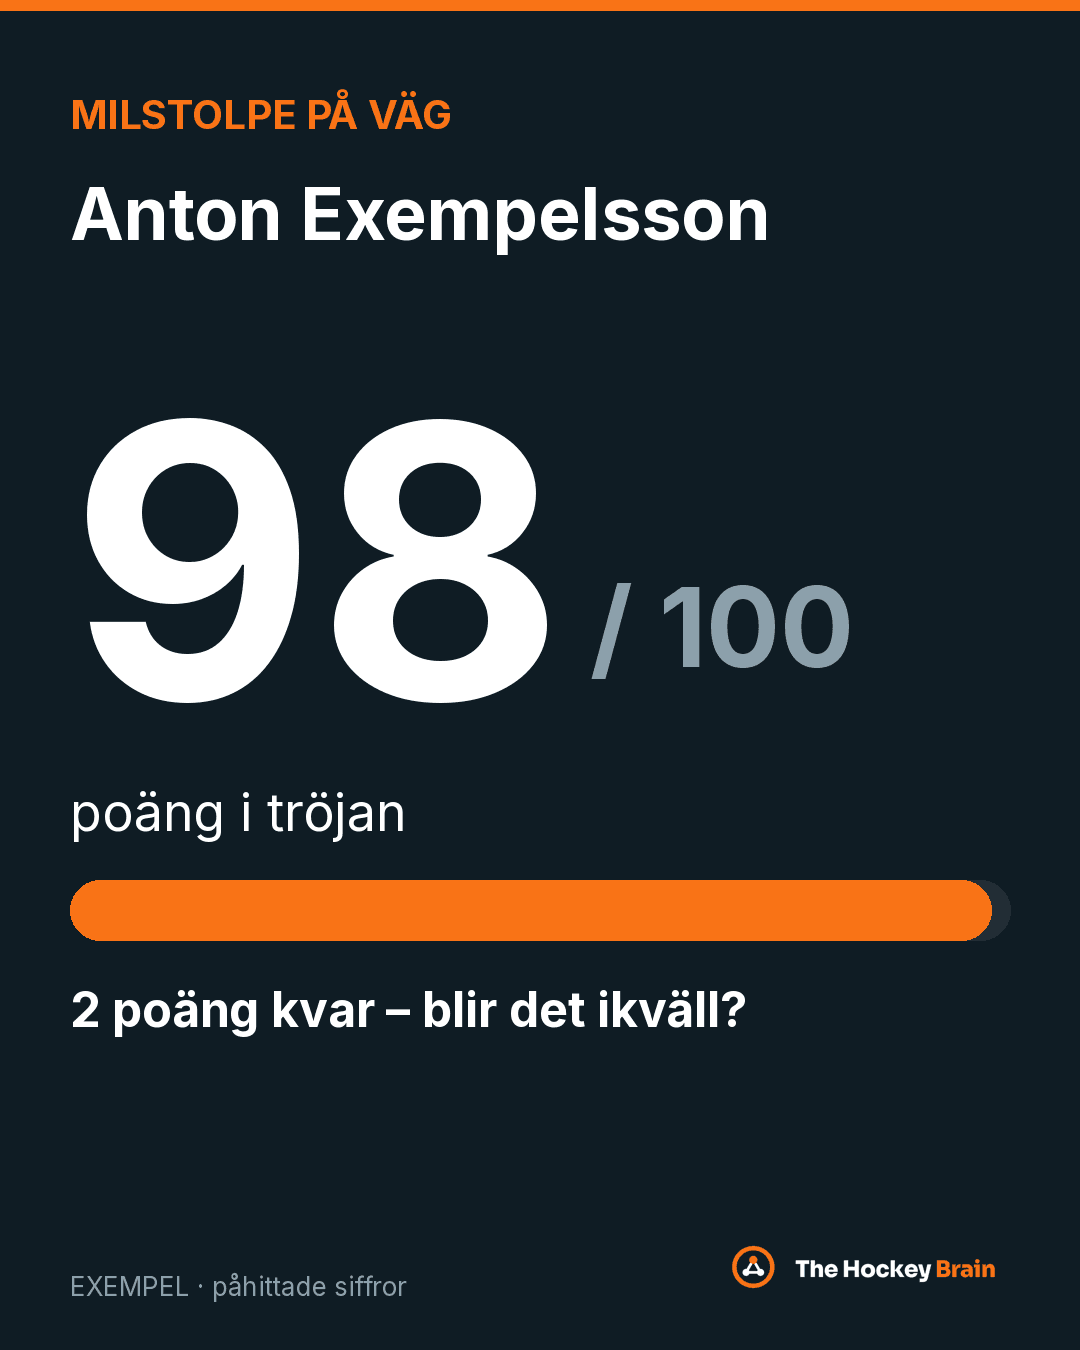
Milestone posts
Know when a player is approaching 100 games or 50 points before anyone else.
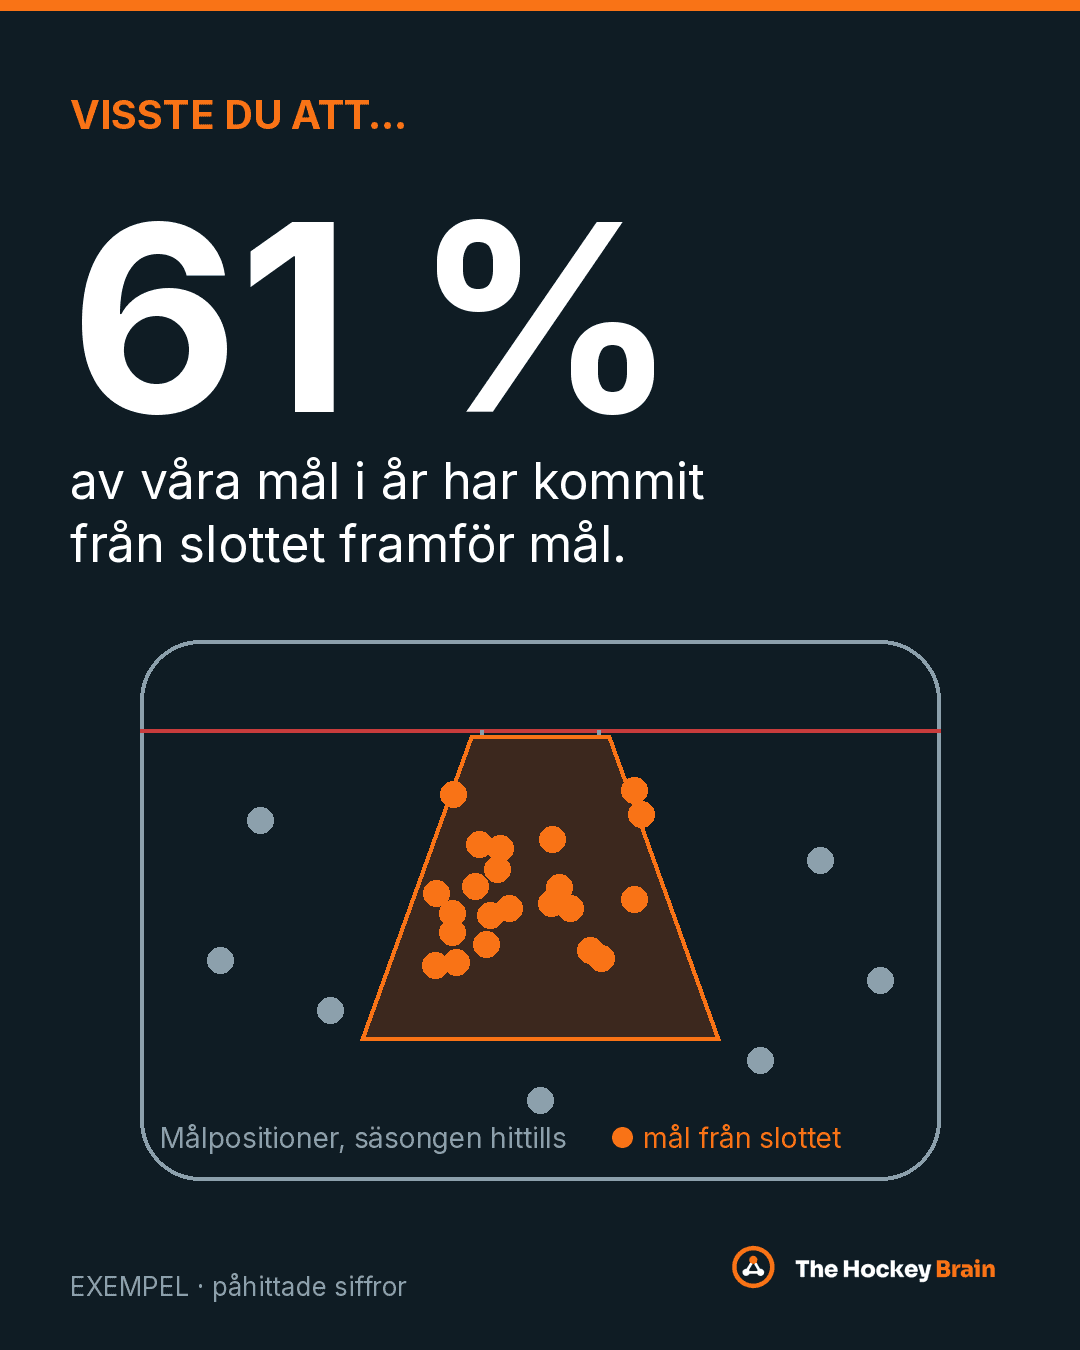
"Did you know…" graphics
One surprising number, ready before puck drop.
Match previews with data
Form, head-to-head and key players in one place.
Fan quizzes
Questions straight from your own numbers.
Season recap videos
The five numbers that explain the season, with clips to match.
Sponsor campaigns with stats
"SEK 10 per save" style activations that update after every game.
Examples
Example – made-up numbers
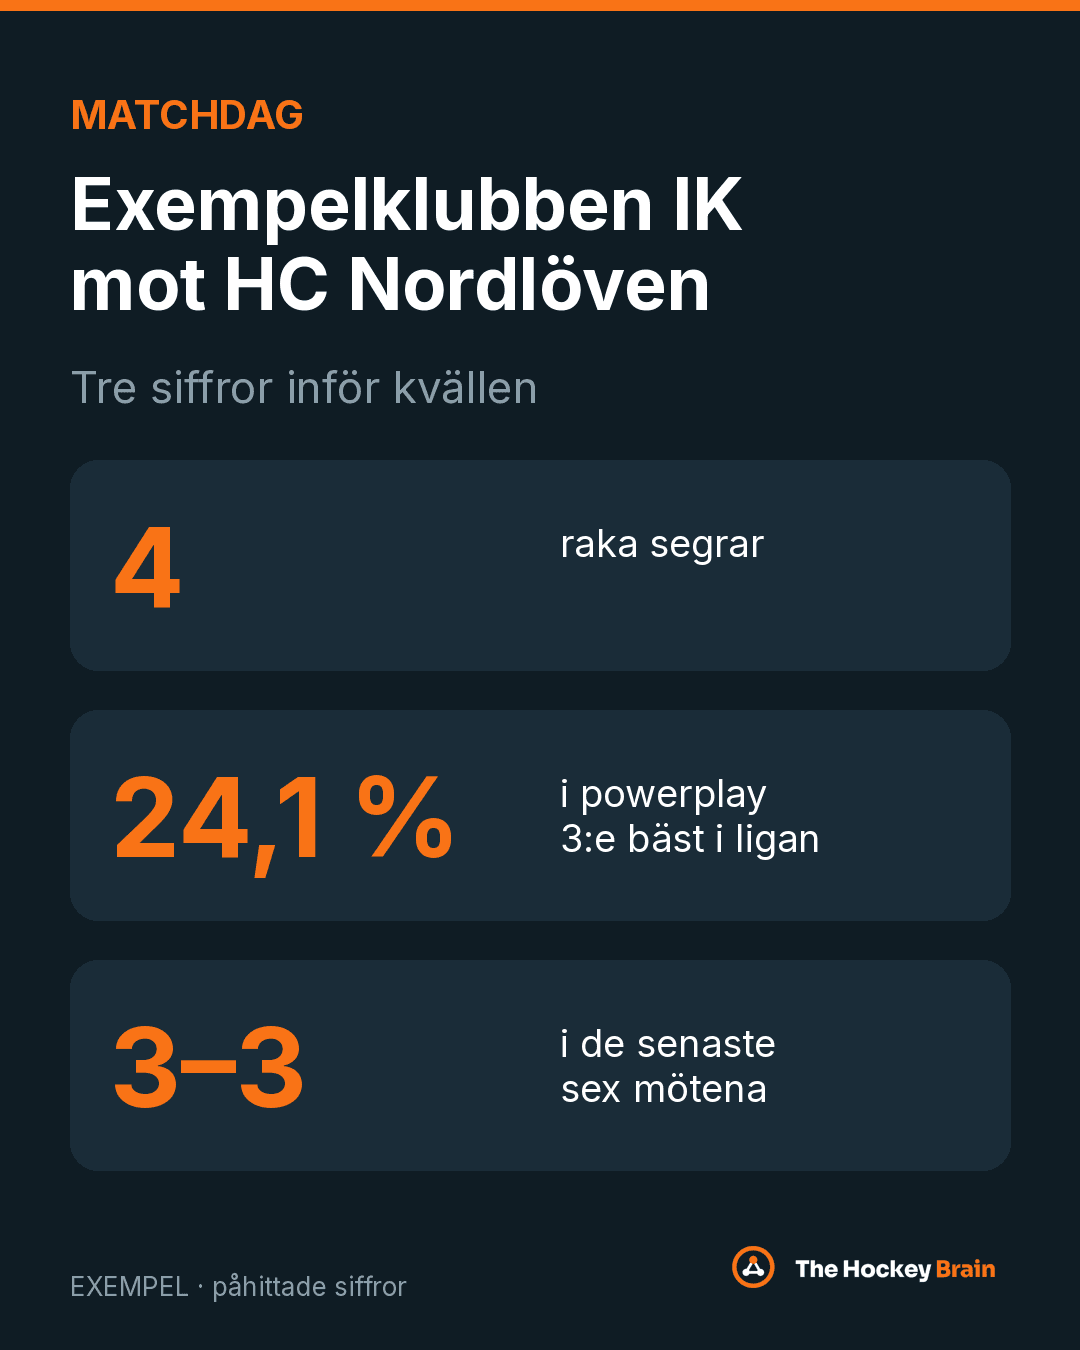
Match preview: Example HC vs Example IK
Form, head-to-head and three players to watch — pulled from one club database.
Read excerptHide
300 games in the jersey — by the numbers
A milestone post built from roster and game logs, not a manual spreadsheet.
Read excerptHide
The season start in numbers
Opening weekend recap — five stats that explain where the club stands.
Read excerptHide
Video concepts
The season in 5 minutes
Five charts, five clips — the story of the season so far without a three-hour edit.
Fastest on the team?
Tracking speeds from your own data, turned into a bracket fans can argue about in the comments.
Before the derby: the data behind the game
Head-to-head trends, special teams and one “hidden” line match-up — published morning of puck drop.
How it works
- 01
We connect the sources you already have – league stats, tracking, video, your own exports.
- 02
Every player is matched across systems in the club's own database.
- 03
Your team asks questions in Excel, dashboards or AI assistants like ChatGPT and Claude. No lock-in – you choose the AI model.
Pilot
We're taking on a limited number of pilot clubs for the 2026/27 season. Fixed fee, no lock-in.